Gain and Read Noise
The conversion gain of the camera and the readnoise
was measured by the following procedure:
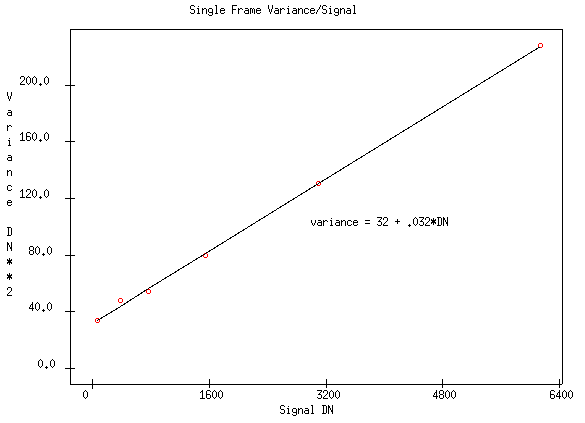
- A series of pairs of exposures using the
Frame method of a
uniform light source were made with different
exposure times.
- The mean signal level
of the frame above bias level was calculated.
- Frames with identical exposures were subtracted and the
variance was calculated.
The variance was then divided by two
to give the single frame variance.
- A linear fit made to the result

The inverse slope of the line gives the conversion gain of the
chip
The intercept gives the readout noise.
- Gain: 31 e-/DN
- Noise: 175 e- r.m.s.
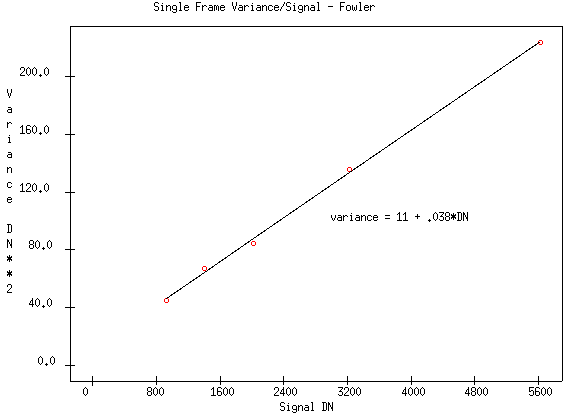
A measurement was taken using the Fowler sampling with the following
results.

- Gain: 26.4 e-/DN
- Noise: 88 e- r.m.s.
Fitting one more point at higher signal level than shown
above leads to differing results.
- Gain: 29 e-/DN
- Noise: 123 e- r.m.s.
Gain Discussion
We can convert the conversion gain into the signal by following
the signal chain which has the following characteristics:
- preamplifier gain: 5.1
- ADC conversion 10 volts range for 16 bits
- 30 µ V at output FET per DN
Hence 1 e- corresponds to about 1 microvolt.
This is a factor of
two lower than mean value of the range (1.5 - 2.5 µ V/e -)
quoted on the
Rockwell
Specification Sheet.
I don't know if this indicates some problem in the measurement,however,
there are other reasons to be suspicious of this value.
Noise Discussion
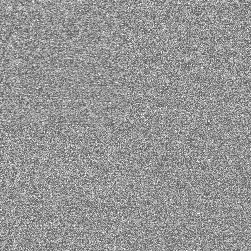
The noise resulting from the difference of two Fowler frames is
pretty white as the next image shows.

The Frame method of reading the chip used above
is subject to the fluctuations in the reset value.
From the responsivity of 1.0 microvolt per electron leads to a
result that the capacity of the detector is 0.16pF.
From thermal considerations the average energy in the
capacitor = (1/2)*k*T.
Since the energy in the capacitor is = (1/2) * C * V 2 .
We calculate that the rms voltage at 100K is about 100 microvolts
or about 100 e-.
This is less than the difference in the two results above.
System Noise
If one grounds the input to the data acquisition system
the rms variation is on the order of 1.0 DN.

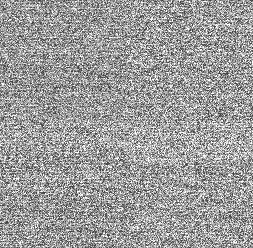
Taking the difference of two highly saturated images
leads to a single frame variance of about 2.8 DN.
The image at the right shows the noise pattern:
Which is a pretty white.
Last Revised September 13, 2000


