Dewar Cooldown
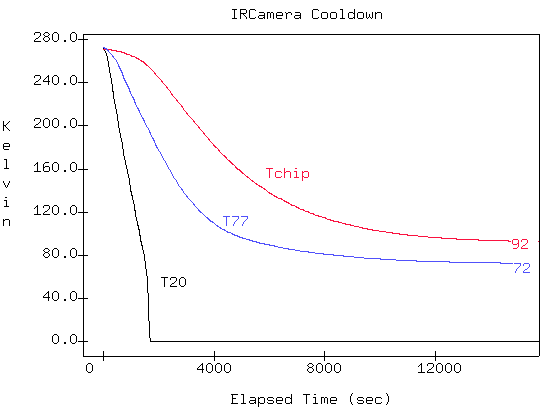
The following graph shows the temperature of the
three stations inside the Dewar as a function
of time as the cooldown progresses.

Note the temperature indicator of the 20 K gives
fals (0K) reading below about 55K.
Last Revised May 4, 1999

